![]()
Journal
Saturday, March 3, 2012
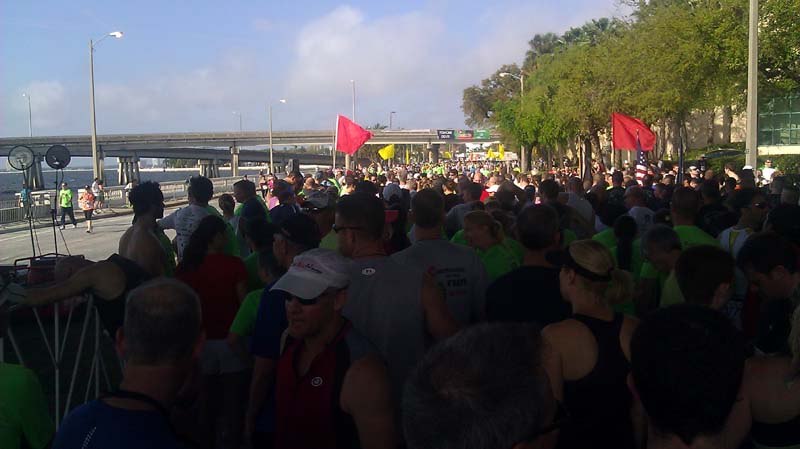
17 minutes before the race starting gun fires.
Waiting in the red flag section with runners having expected finish time between 25 and 30 minutes.
Ahead is the yellow flag section with runners having expected finish time less than 25 minutes.
It took 1 minute, 44 seconds to reach the start line past the yellow flags.
| Year | Race Time | Pace (per mile) |
Speed (miles per hour) |
Overall Place | Gender Place (Males) |
Division Place (Males Age Brackets) |
| 2012 | 26 min 49 sec | 8 min 39.0 sec | 6.94 MPH | 1083 / 11916 (top 9.1%) |
831 / 4855 (top 17.1%) |
101 / 578 (top 17.5%) |
| 2011 | 27 min 42 sec | 8 min 52.6 sec | 6.71 MPH | 1373 / 10431 (top 13.2%) |
1014 / 5252 (top 19.3%) |
111 / 678 (top 16.4%) |
| 2010 | 28 min 10 sec | 9 min 1.6 sec | 6.60 MPH | 1756 / 9644 (top 18.2%) |
1270 / 4061 (top 31.3%) |
126 / 438 (top 28.8%) |
| 2009 | 28 min 56 sec | 9 min 16.4 sec | 6.44 MPH | 1672 / 8686 (top 19.2%) |
1171 / 3661 (top 32.0%) |
136 / 419 (top 32.5%) |
| 2008 | 26 min 55 sec | 8 min 41.0 sec | 6.93 MPH | 1294 / 7650 (top 16.9%) |
949 / 3397 (top 27.9%) |
133 / 414 (top 32.1%) |
| 2007 | 28 min 19 sec | 9 min 8.1 sec | 6.58 MPH | 1505 / 6650 (top 22.6%) |
1076 / 3026 (top 33.6%) |
130 / 386 (top 33.7%) |
| 2006 | 29 min 52 sec | 9 min 34.3 sec | 6.24 MPH | 1997 / 6478 (top 30.8%) |
1381 / 2975 (top 34.7%) |
155 / 327 (top 47.4%) |
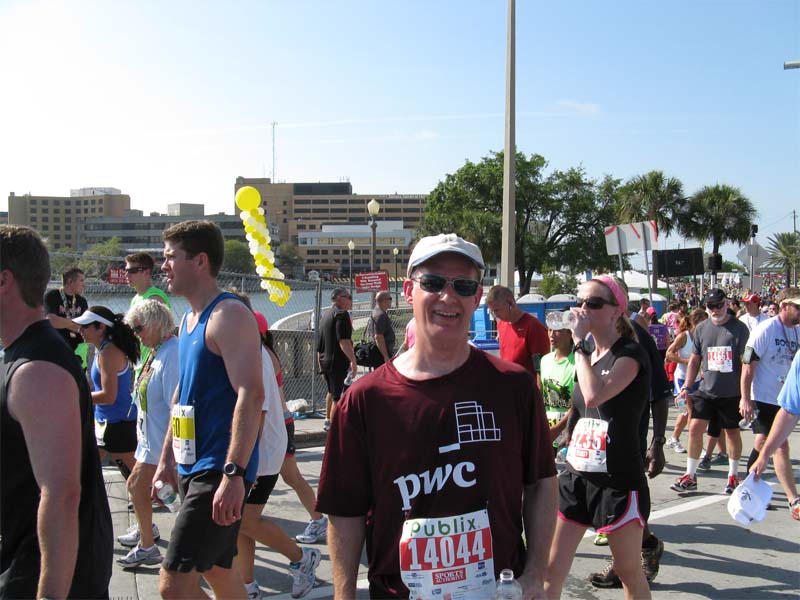
Shortly after crossing the finish line
![]() Back to Journal
Back to Journal
![]() Back to Kevin E.
Olson Home Page
Back to Kevin E.
Olson Home Page